product / development
SectionsCRM
A custom lead management platform for nurturing and tracking prospective students.
Overview
Marketing + Admissions had been using 4-5 different platforms to collect lead information, nurture prospective students, and manage student information. We set out to create a product that at the very least achieved parity with the platforms we were using and removed redundancies.
Problem
By using multiple platforms for different purposes, data was fragmented (or missing), reporting was inconsistent, and workflows were disjointed. We were always iterating on our Admissions process and had different requirements for different courses we offered. Trying to coordinate multiple pieces of software whenever we made a change was impossible, and productivity suffered.
Requirements
After talking with the Admissions, Academics, and Dev teams, we gathered a list of requirements that would get the product to parity with what we were currently using, allowing us to move off of multiple platforms, and onto one.
- Single source of data
- List of individual lead inquiries, applications, RSVPs
- Email Notifications
- Show lead’s progress in the pipeline
- Mark lead as cold, warm, hot, do not contact, etc.
- Filter/sort leads based on multiple data points
- Log of conversations
- Marketing channel analytics
- Support for future integrations (MailChimp, Slack, Intercom)
Process
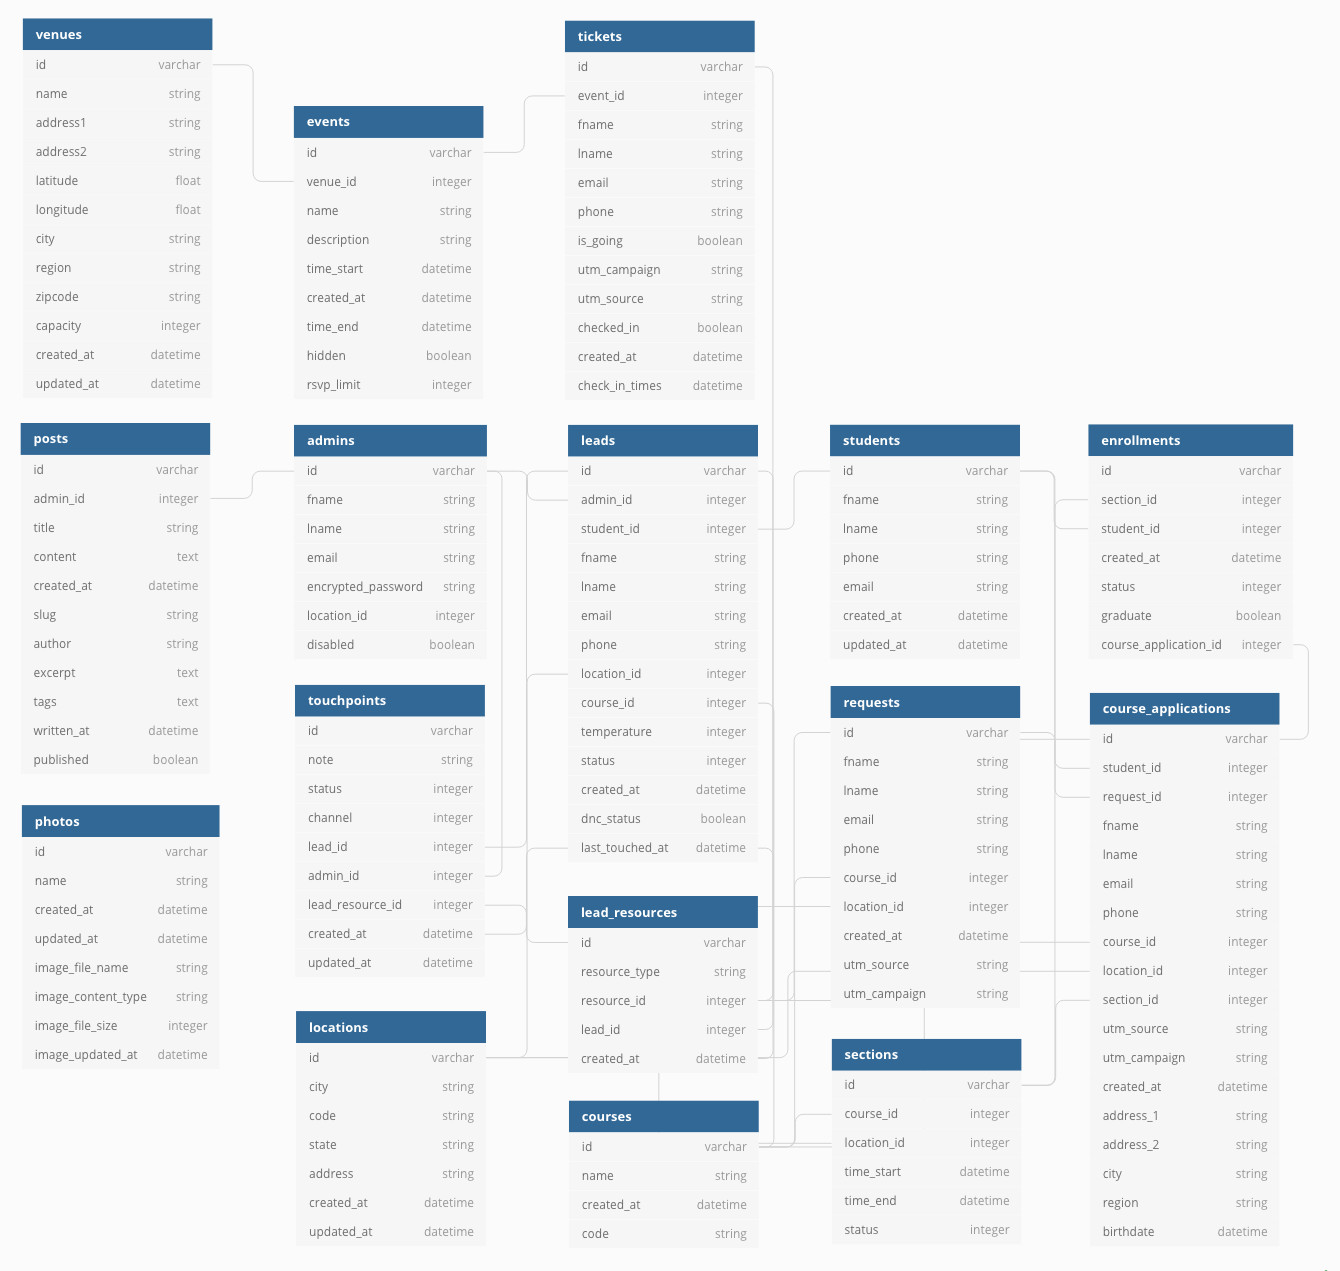
The biggest piece of the puzzle was creating a unifying record to tie everything together. Before SectionsCRM, pieces of different records were being sent to other platforms via API, and it was very difficult to tie data together. We kept these records clean with some de-duplication logic and the ability to manually merge leads. We also created a polymorphic table that would tie everything related back to the lead so Admissions Officers had a full picture of each lead’s qualifications. This included requests for information (Requests), Course Applications, and Tickets for events. Once a lead converted to a student, we were able to tie those records together as well. Eventually, we ended up with a database structure that looked something like this.
The Lead Index
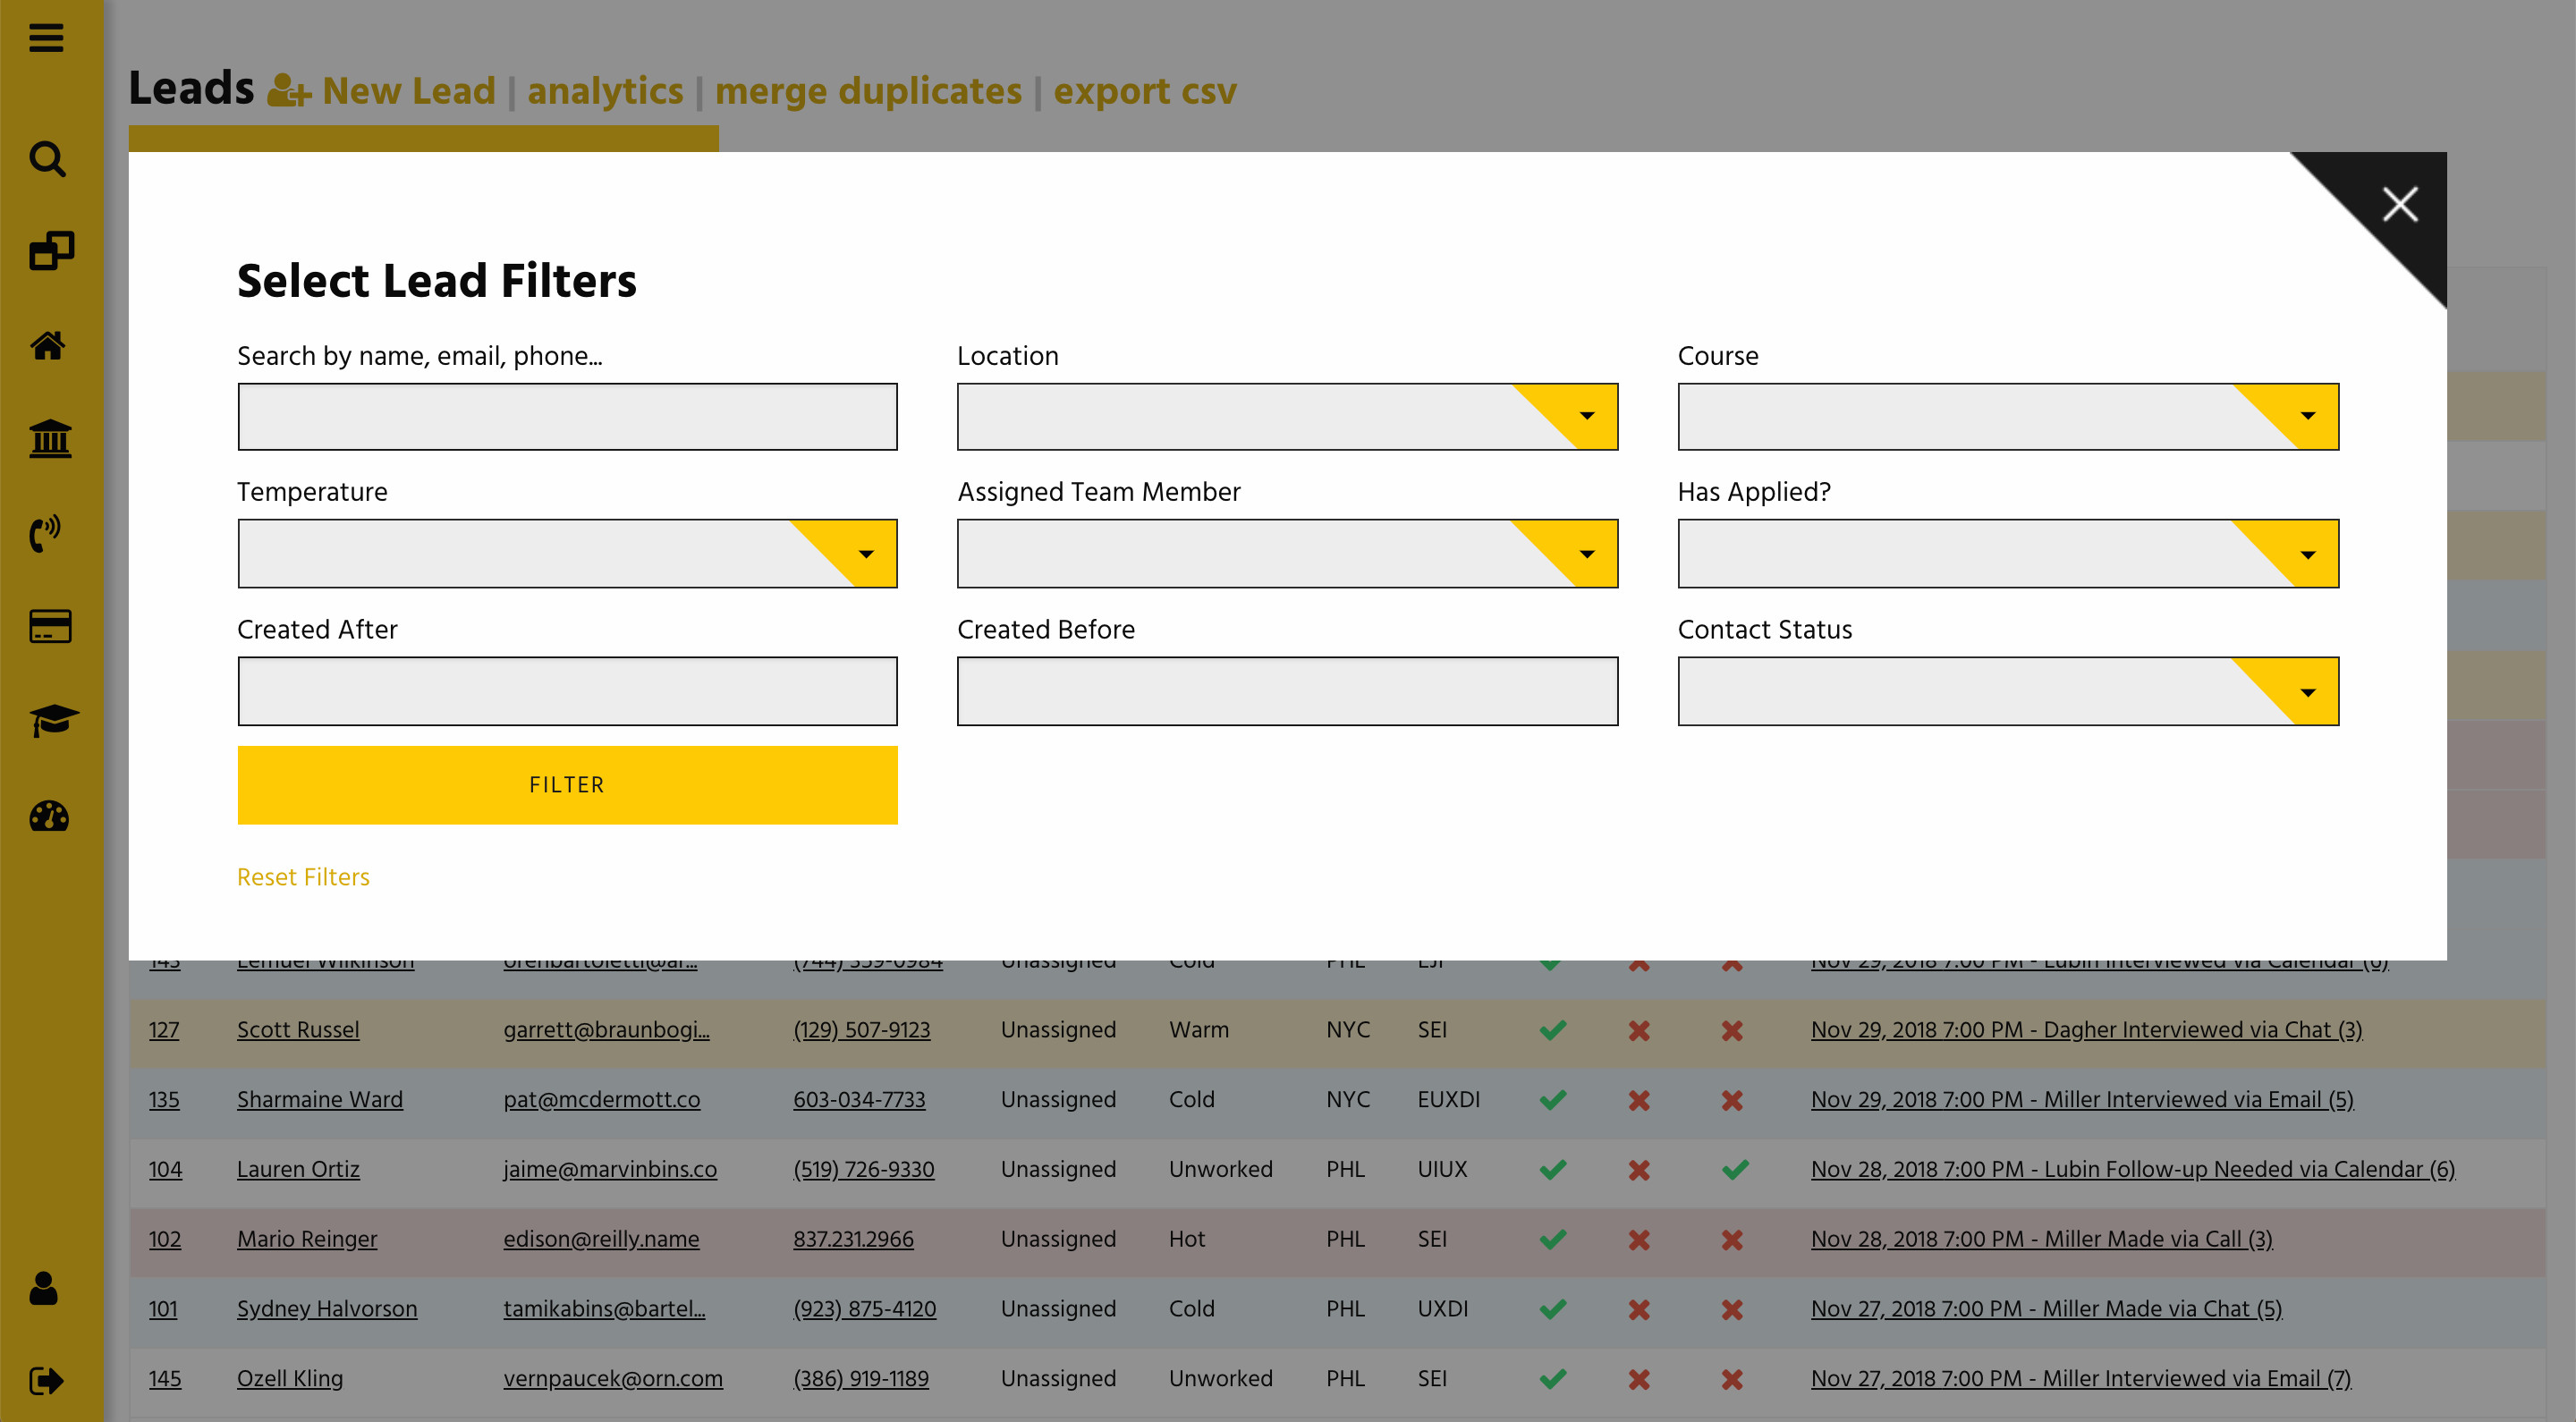
The next step was putting a view layer on top of the data that was easy for the Admissions team to interact with. We wanted to give them filtering and sorting abilities to help them determine which leads needed to be worked. Leads are automatically created whenever a Request for Information or Course Application comes in, but AOs can add a lead manually as well. Whenever a new lead comes in, a notification flashes across each AOs screen, and an email is sent with a link to the Lead Profile page.
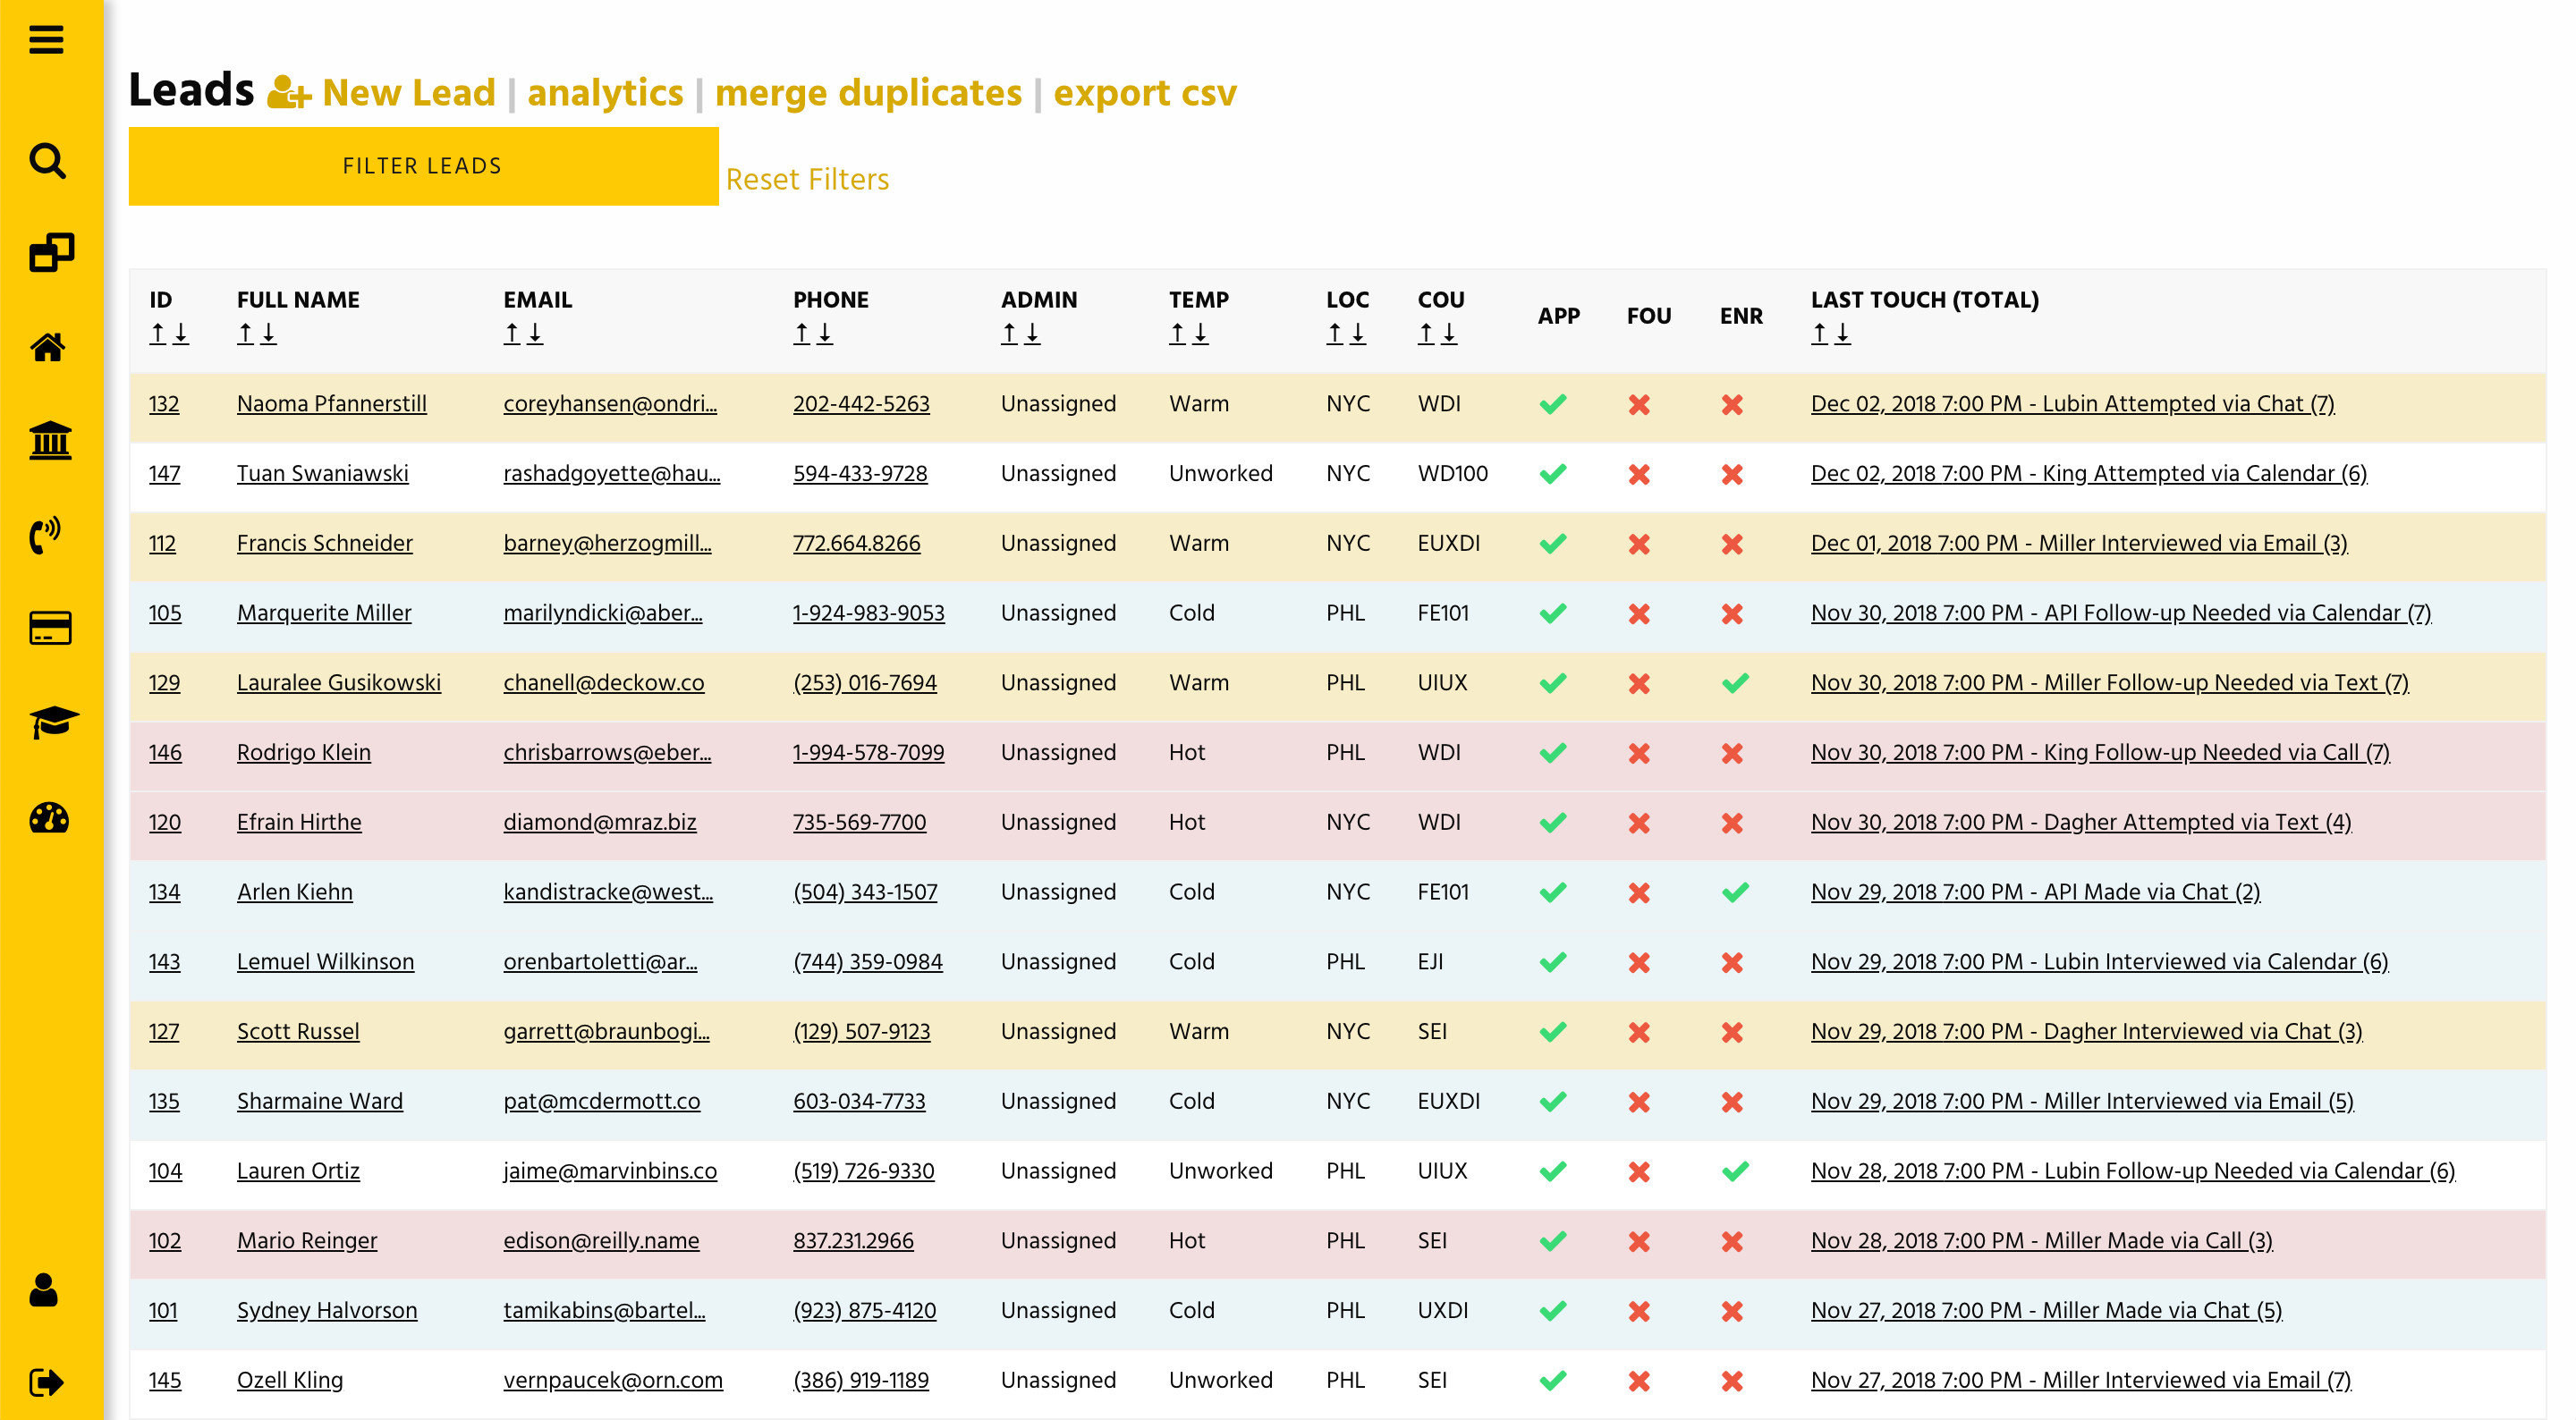
The table also gives Admissions officers some high level information to base their next interaction off of. They can see when and how a lead was last contacted, where they are in the enrollment process, as well as contact, course, and location information. After filtering a list of leads, the table could be exported to CSV for mail merges, importing into other platforms, or general reporting.
The Lead Profile
The Lead profile page gives Admissions Officers a detailed view of the activities around a prospective student, including Course and Location preferences, Requests for Information and Applications, Event RSVPS, and a log of all Touchpoints. AOs can quickly update contact information and preferences, add new Touchpoints, and send event invitations. Tooltips and highlights give additional visibility into the lead pipeline. Class capacities and days to start are shown for quick reference when making contact with a lead.
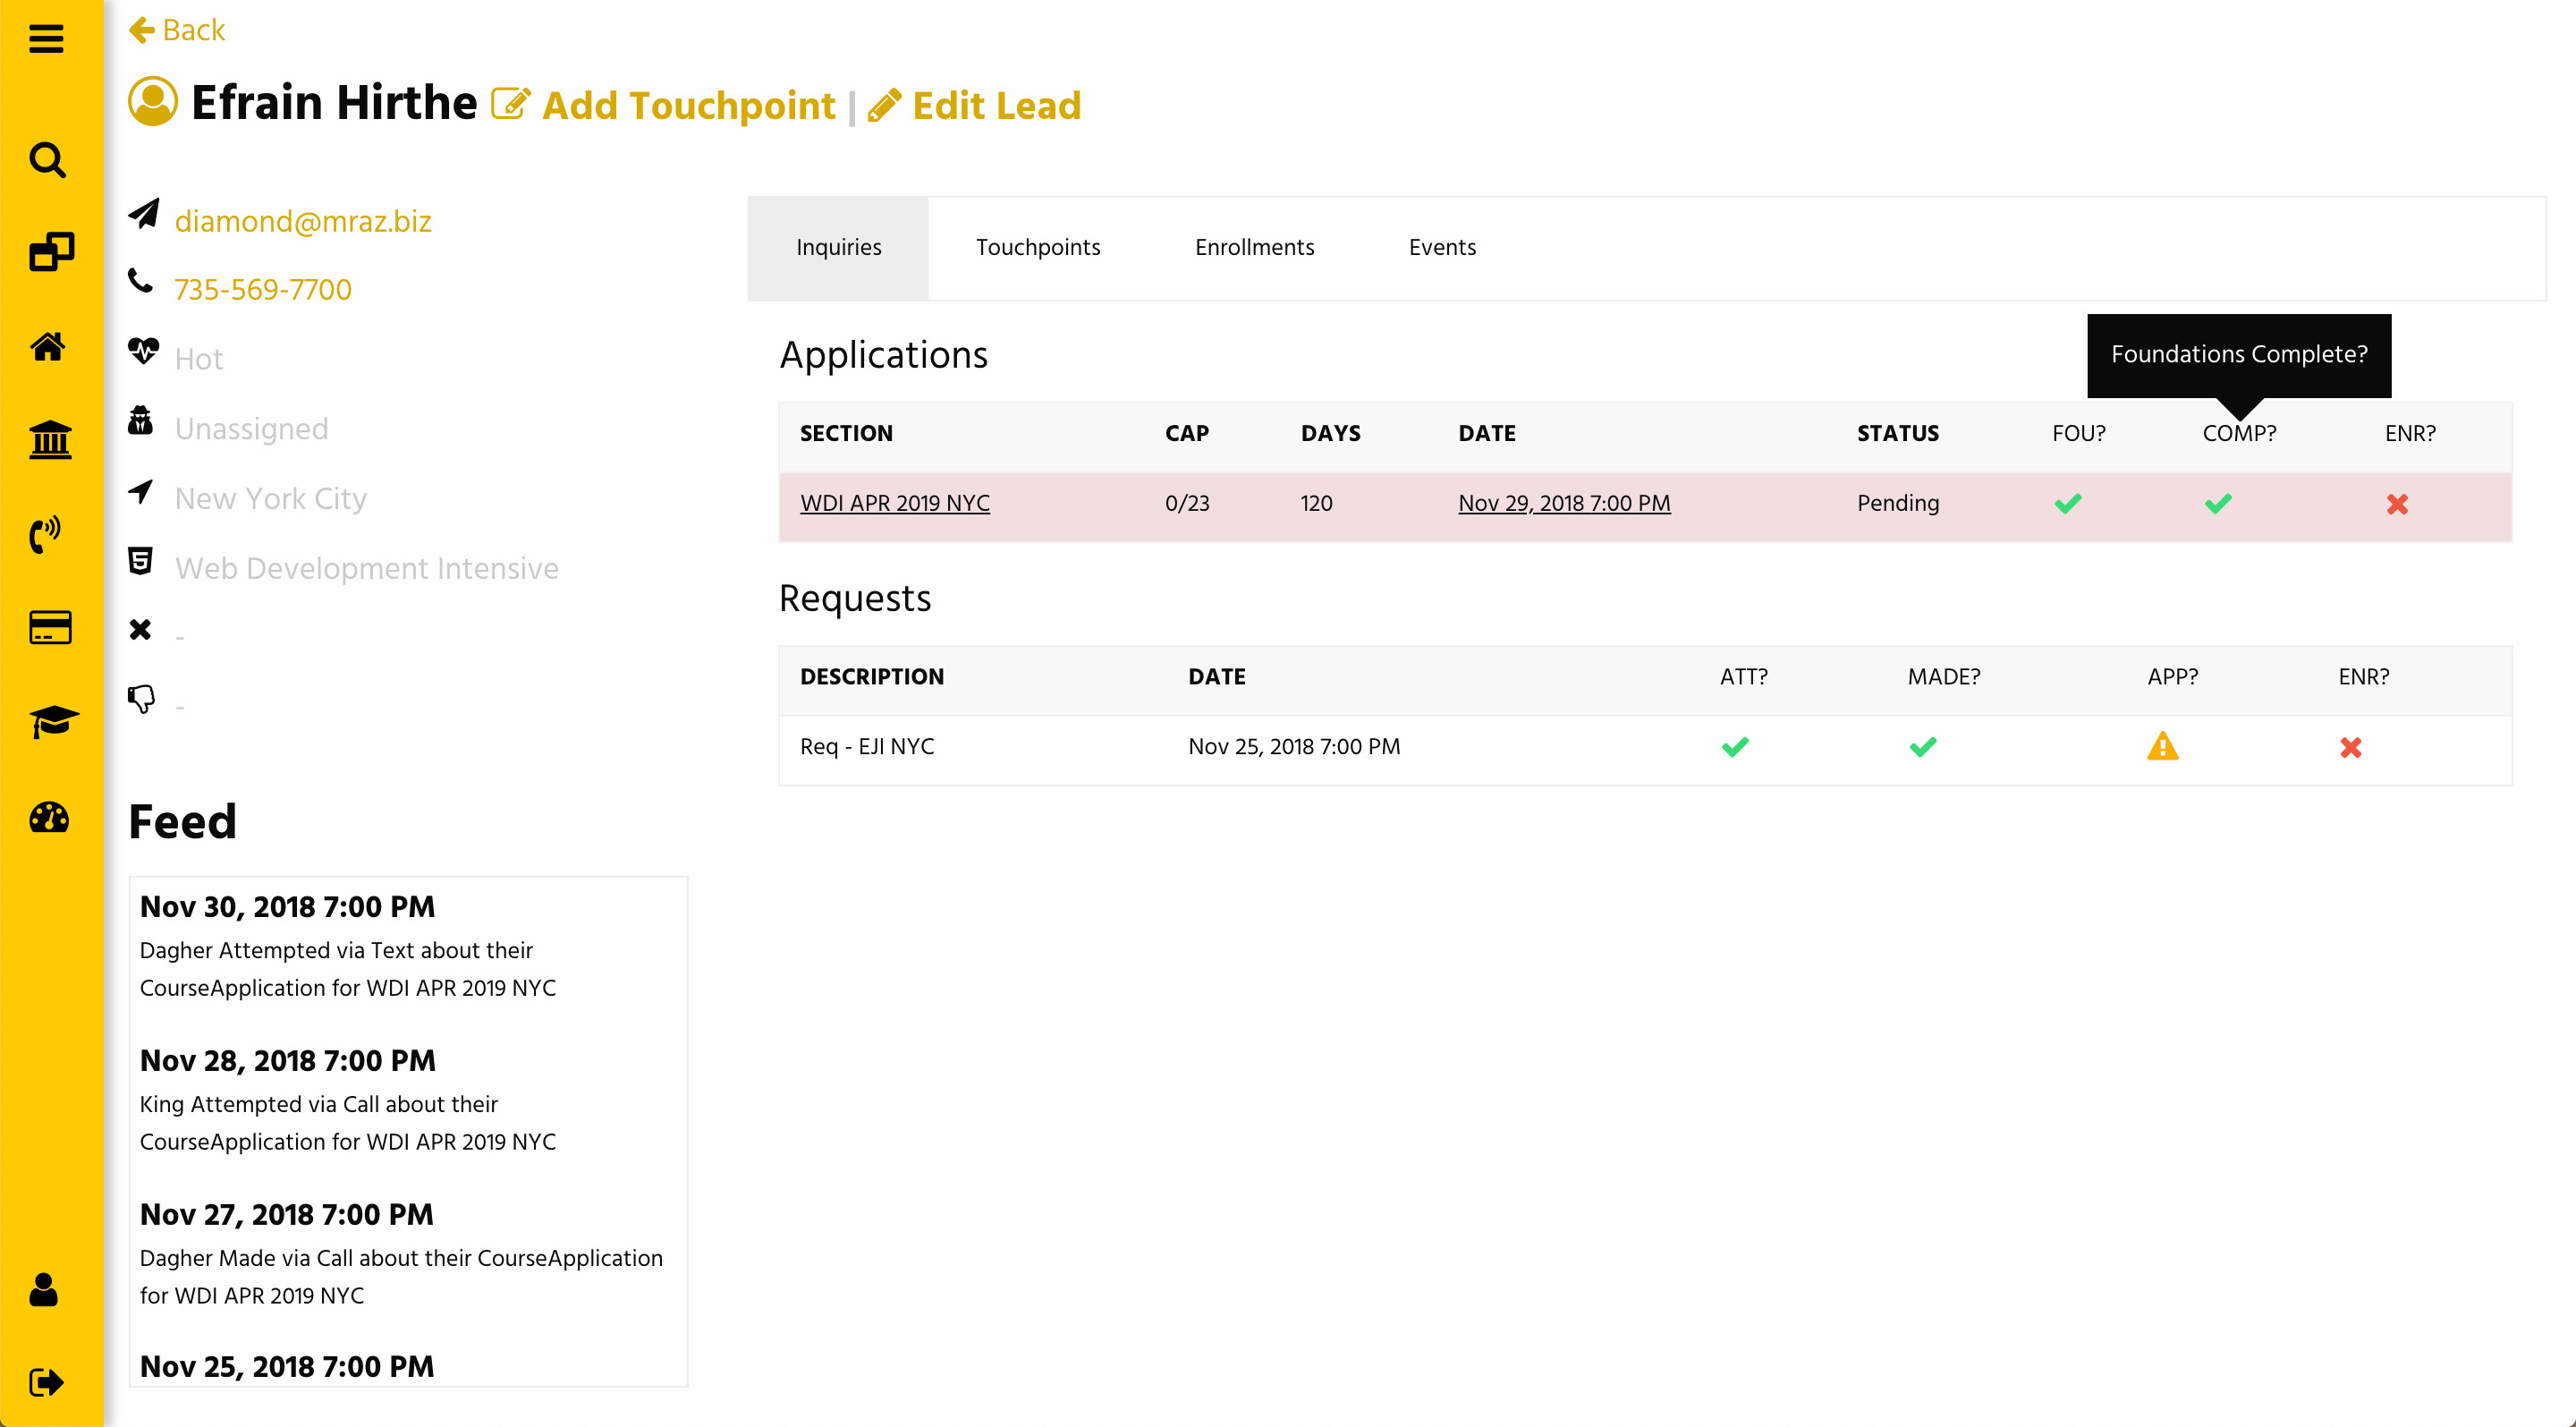
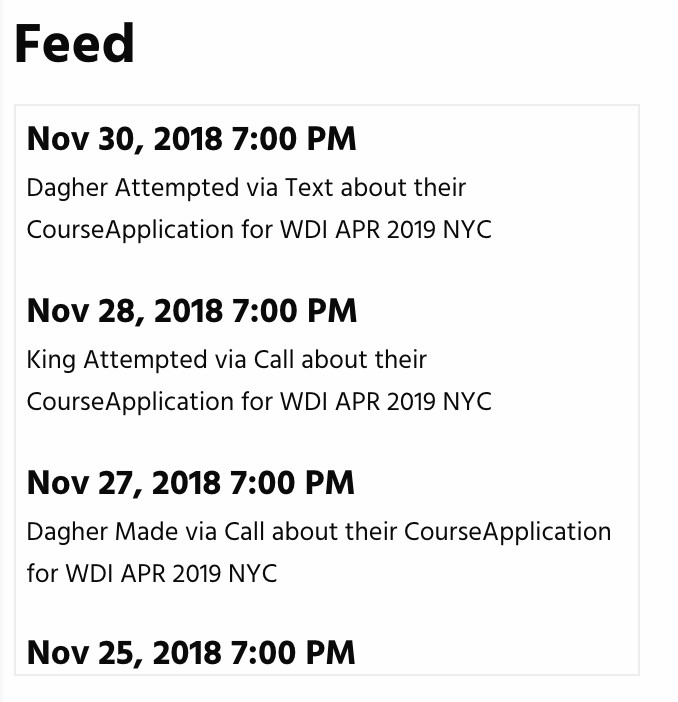
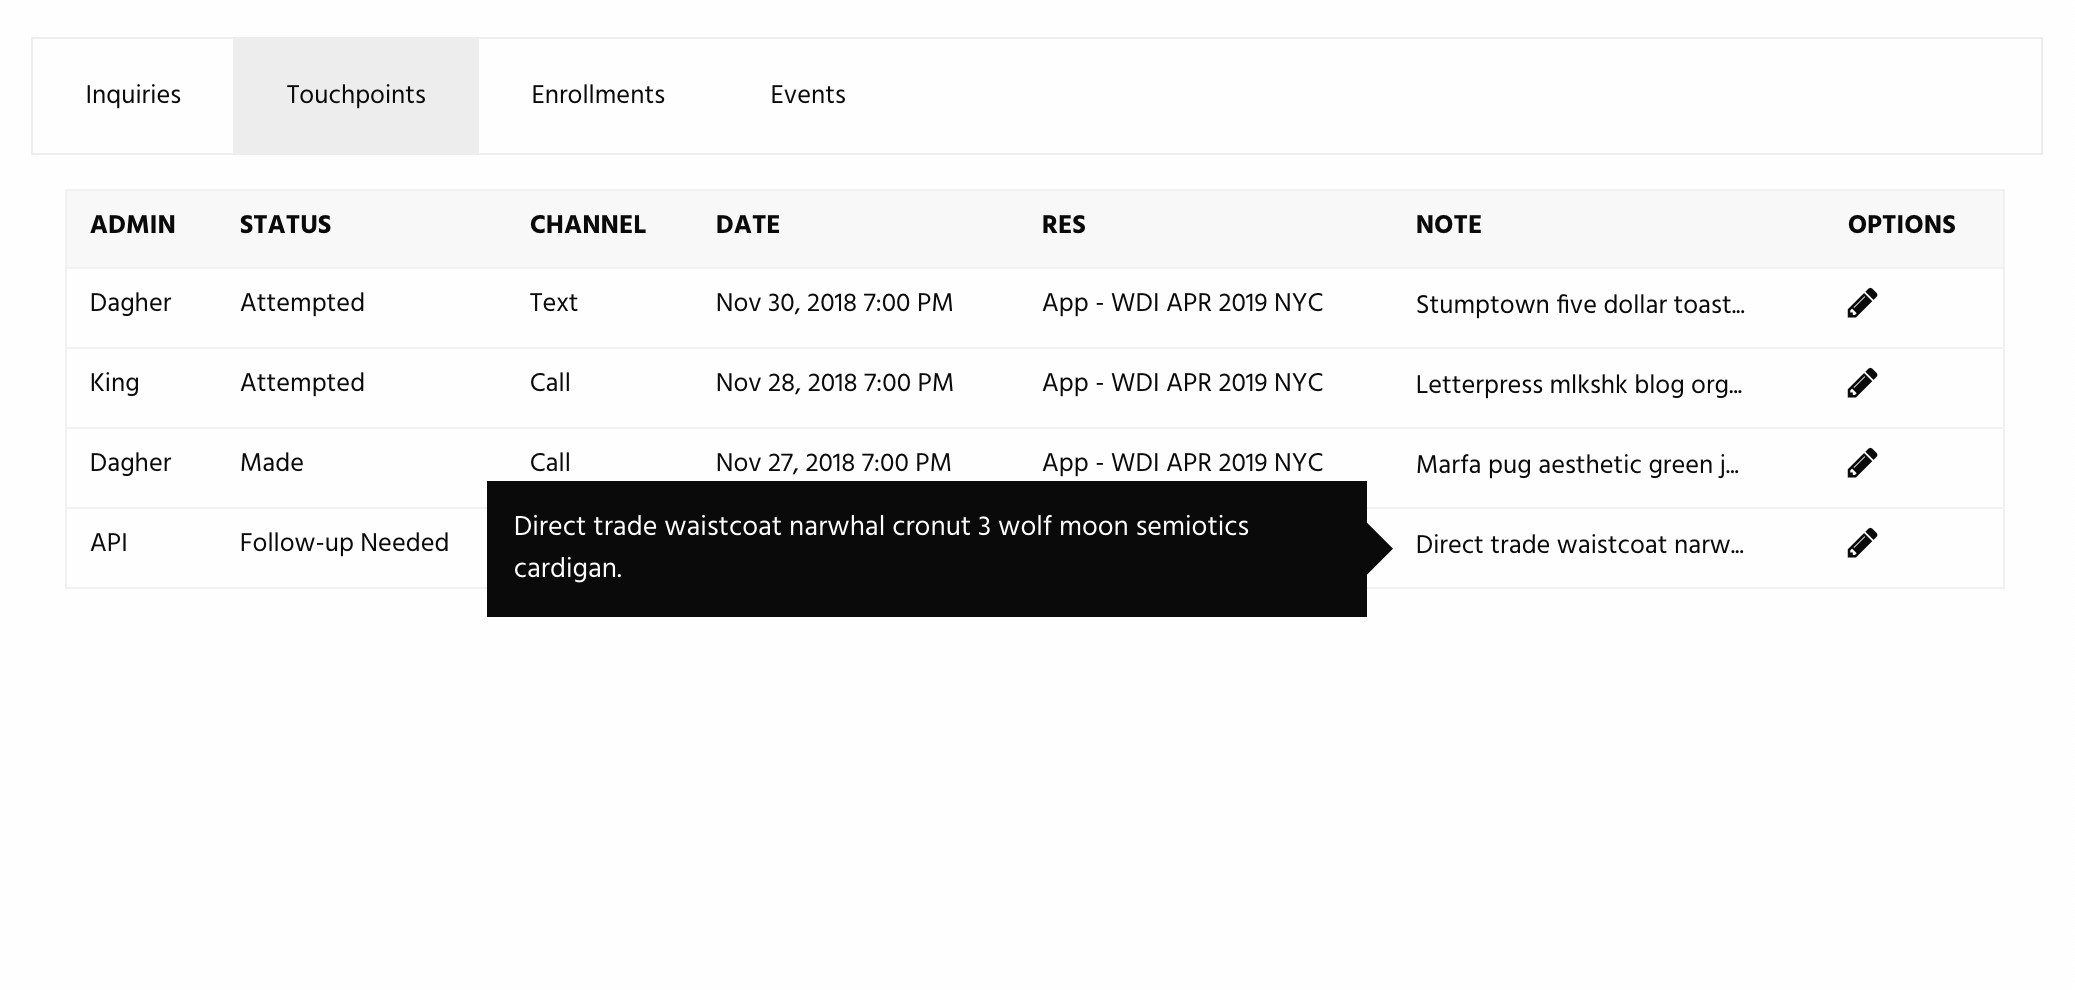
Updates to leads are broadcast to the Lead Index in real-time, so AOs aren’t duplicating work and contacting the same prospective student.
Analytics
Having all of the data related to Lead activity in one database allowed us to generate reports on almost anything. This was incredibly useful for marketing to track trends in lead acquisition and overall enrollment. We built in charts to visualize volume and channel sources over time.
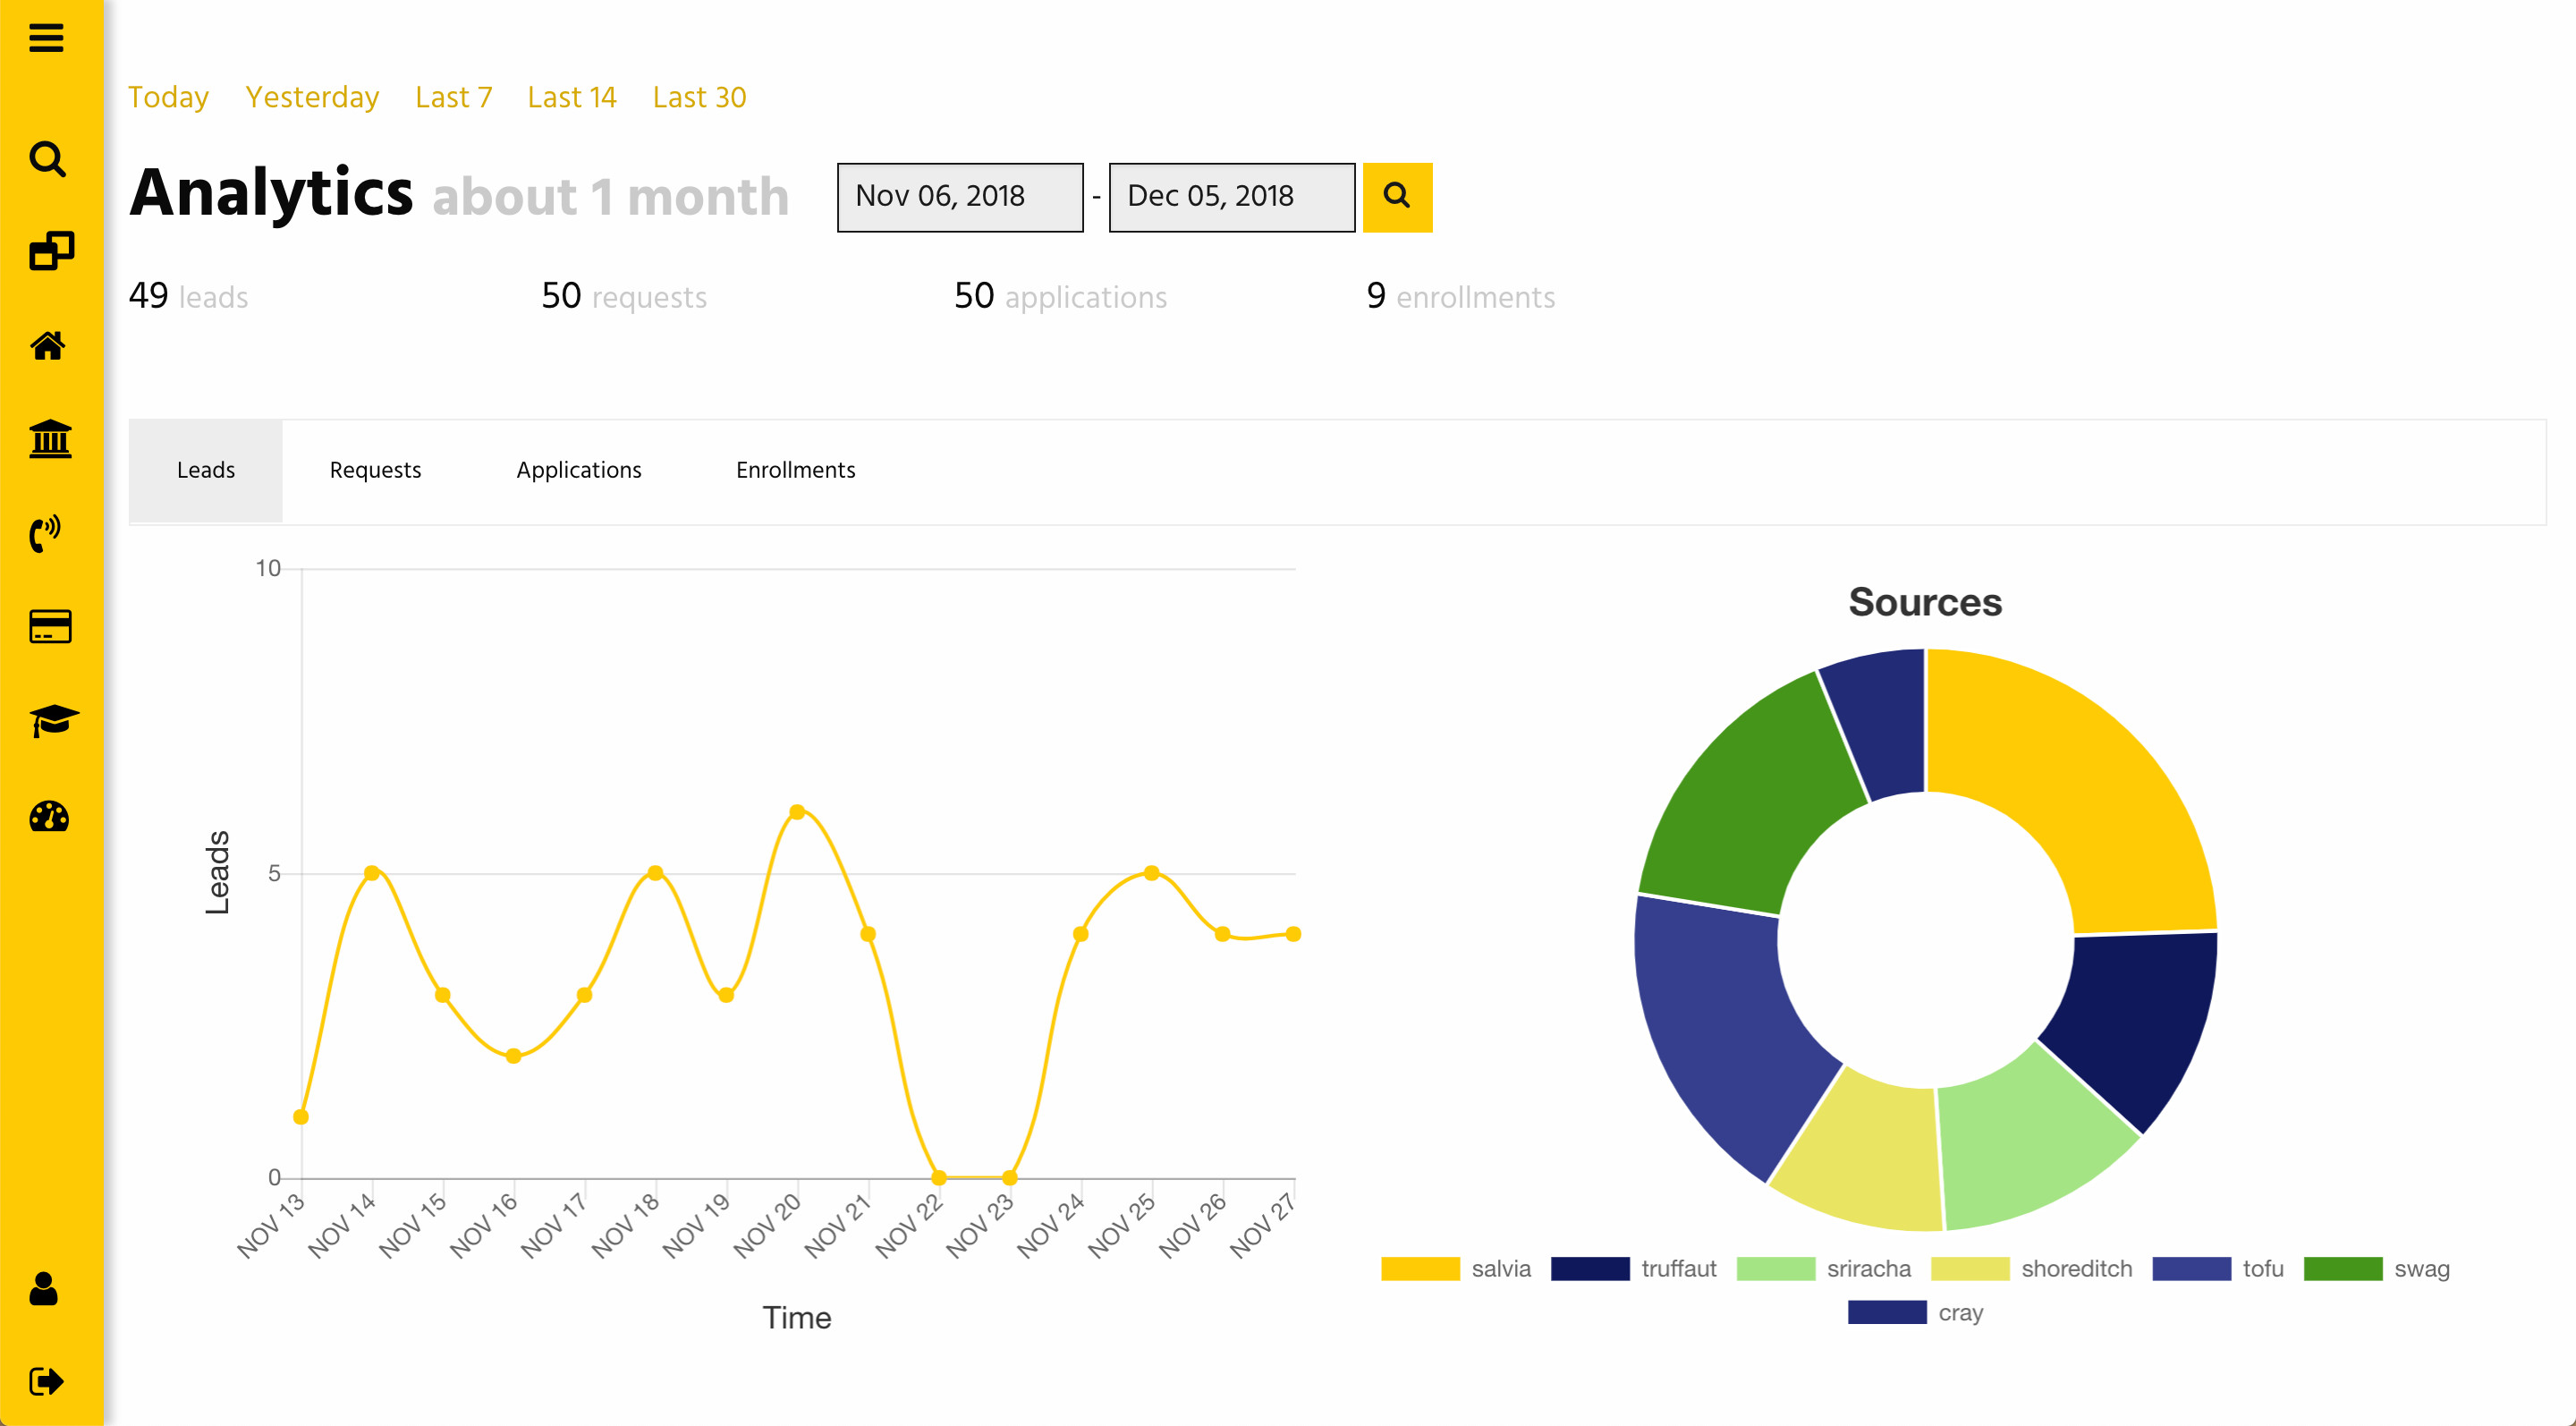
Charts and reporting around Lead Touchpoints are currently in progress. Soon, we’ll have visualized data on how leads respond to different outreach strategies, which channels are most effective, and how many points of contact are needed to enroll a student.
At the end of each day, and automated email is sent to key stakeholders reporting on the number of new Leads and Applications came in and for which courses, contact rates for new leads, and which marketing channels drove the most volume throughout the day.
Results
In the first 3 months after launching the new platform, we saw improvements across key metrics.
- Daily Contact Made increased from 15% to 20%
- Increased Lead-to-Application rate from 33% to 50%
- Increased Lead-to-Enrollment rate from 1.5% to 2.2%
Feedback from Users
- “This has made our world so much better.”
- “I will say that the reactive design of the Sections CRM works flawlessly!”
- “The team is loving the Info Request email direct lead link! Nice work and Thank you!”
- “The feedback has been very positive from the AO’s. We really appreciate your diligence in deploying the improvements as we go. Really looking forward to the next phase of the build out as we start exploring more of the data analytics behind our Admissions operation.”